The following are a collection of observations identified by repeated
and long term running of a set of Phoronix Test Suite based tests orchestrated
under Phoromatic. No attempt has been
made to identify the underlying cause of the regressions, but merely to
illustrate the value and opportunities of broad and consistent testing
done in an automated fashion.
The results were pulled from the respective trackers by adjusting the
number of days to 180 and regenerating the page.
Some notes on Terminology
Regression
The term regression within this page is used consistently to refer to
an unexpected change in behaviour. Until analysis is conducted, a
regression may caused by either an intended and unintended change.
Obviously an intended change is no longer a regression, even if
the impact of the change is negative against a particular measure.
Further, an intended change that is negative impact, may also
have a positive impact elsewhere. Whereby the first impact is not
a regression, but the second one is.
The term positive and negative regression will also be used within the
discussion below. A negative regression is your typical
regression that most people would consider a regression. A positive regression is a regression
that has a beneficial impact. However, a beneficial impact that
is unintended usually means either someone has done something amazing
and you want some more of that, or someone has created a shortcut that
may have introduced a performance impact at the expense of some other
safeguard in the system. A similar dichotomy can be found in the
financial markets where a company that either misses their guidance in
a negative or strongly positive manner will invariably be punished by
the stock market for lack of understanding of their business.
System vs Subsystem Testing
There is strong debate within the community of people reading about and
analyzing results about the relative value of generic (broad tests) and
targeted subsystem tests. Some observations will be made at the
bottom of the page, however this fundamentally a religious issue and
most likely won't be resolved.
Ubuntu Tracker
http://www.phoromatic.com/ubuntu-tracker.php
The Phoromatic Ubuntu Tracker runs a set of tests everyday and is
targeted to test the very latest Ubuntu development packages. The
latest Ubuntu packages from the development repository (currently,
10.04 Lucid) is pulled by the test systems every morning at 2AM CST.
After a reboot, the autonomous testing begins and takes most of the day
for this daily-system-tracker test suite to execute after which the
results are uploaded to this tracker page.
Find/Fix Regression
The three graphs below show a regression within Ubuntu that was
resolved. This resolution may have been directed (ie: someone saw
a regression and resolved them) or undirected (upstream fix,
serendipity, etc).
Regression
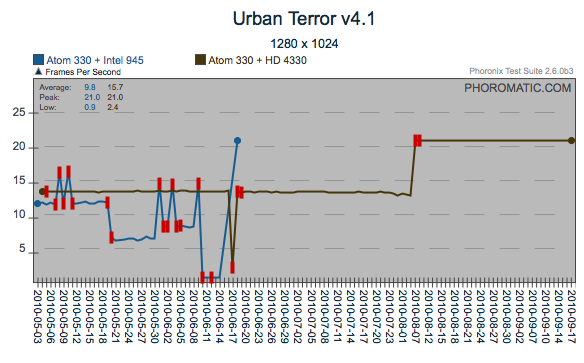
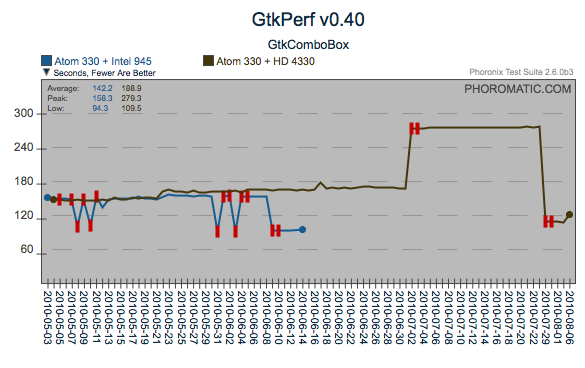
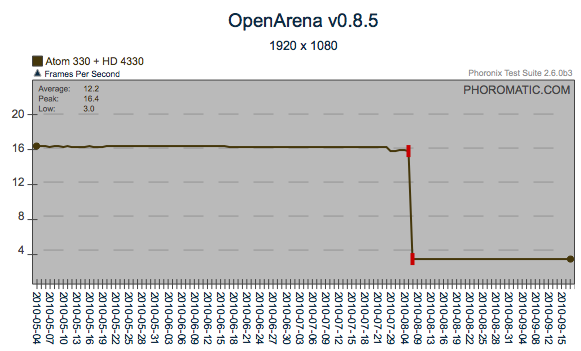
These four graphs show a regression that appears to have been
introduced around the 7th of August, 2010. This particular
regression has an interesting pattern. For Urban Terror, it was
what I call a positive regression (ie: the performance increased, vs
decreased). However, for OpenArena and the GtkComboBox, the
regression was negative. What makes this even more interesting is
that within the gtkcombobox test, there has been another positive
regression which has actually improved gtkcombobox to a better level
than the primary negative regression, potentially quantifying and
resolving the primary regression will improve the gtkcombobox scores
even further. Likewise with gtkradiobutton.
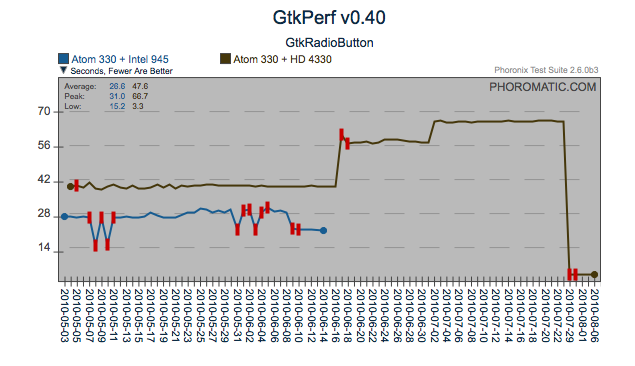
Sensitivity to change
In some scenarios, a test that is sensitive to multiple subsystems
serves as an important measure. Contrasting the two tests below,
you can see that there was a change that affected the GtkRadioButton
test in isolation of the common regression towards the end. From
an analysis perspective, the GtkComboBox test may have a strong
correlation to a particular subsystem and serves the maintainers of
those subsystems well. However the GtkRadioButton is sensitive to
multiple subsystems and consequently is limited in direct value to a
particular subsystem, but serves as a valuable sentinel of a change,
that warrants further investigation into the broad collection of
changes that occurred around that time, or a closer look at other
results for a behavior changes that happened in sync with this
regression.
Kernel Regressions
http://www.phoromatic.com/ubuntu-tracker.php
This is a test schedule that runs daily after the test system(s)
automatically install the latest mainline Linux kernel. It is
created by downloading the ubuntu daily kernel rebooting and running
the test.
Find+Fix
A nice example of a regression that was found and resolved in a small
wind of time.
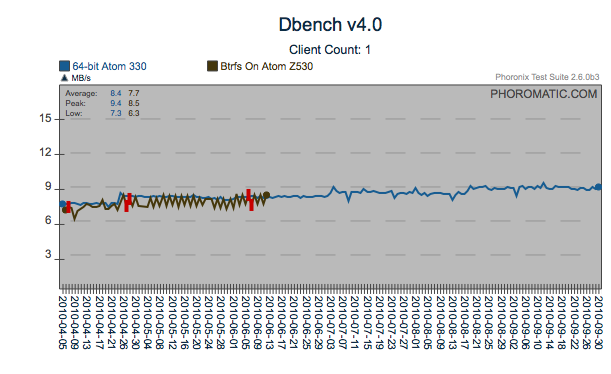
Possible Open Regression
Around the 17th of September, there was a regression introduced to the
kernel that can be seen here. Again, what is generally a
negative regression for the first two graphs is a slightly positive
regression for the last graph (dbench - client count 1). By
observing the other portions of the graphs, you can see that there have
been around three extra performance changes affecting these tests since
April (4/21, 5/20, 7/3). The different tests are affected to a
different level.
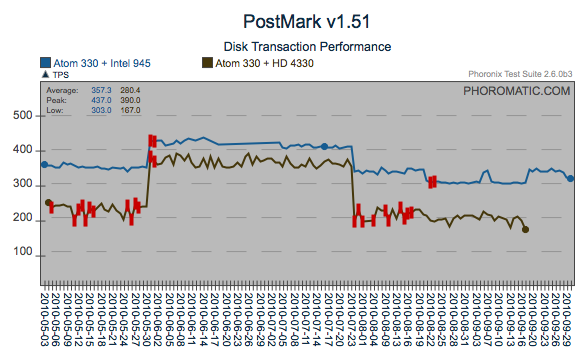
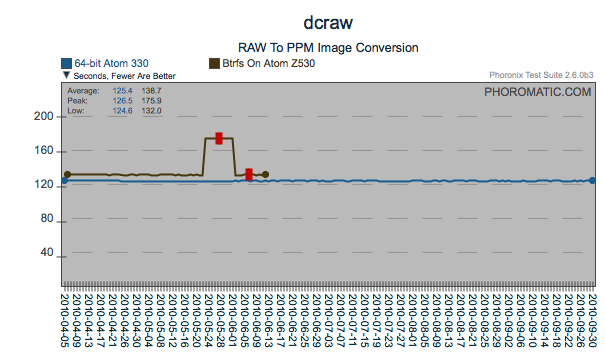
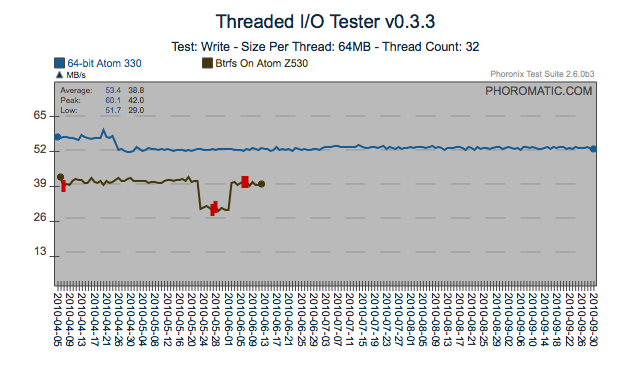
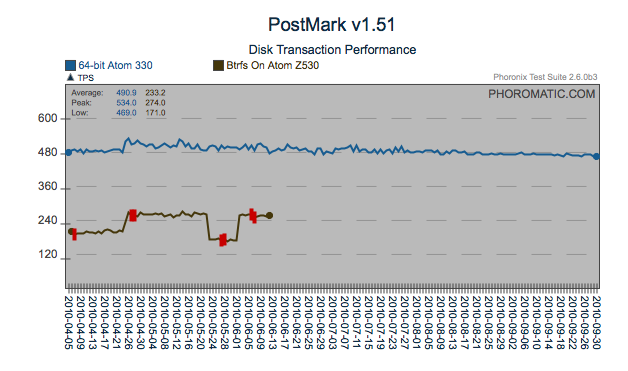
Regression
Here is another regression that was most likely introduced by the 4/21
issue identified above. However in the case of PostMark, the cost
of the regression has most likely been recovered through what appears
to be incremental changes. Another find/fix regression on the
AtomZ530 is visible too.
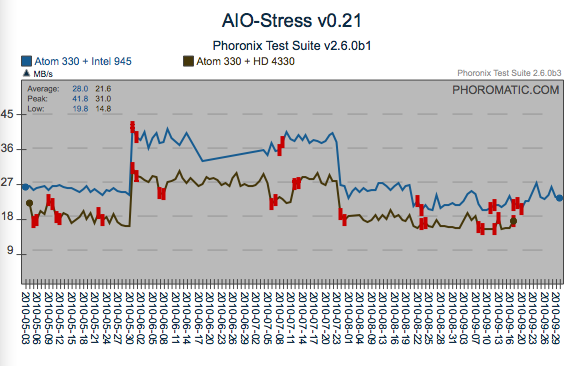
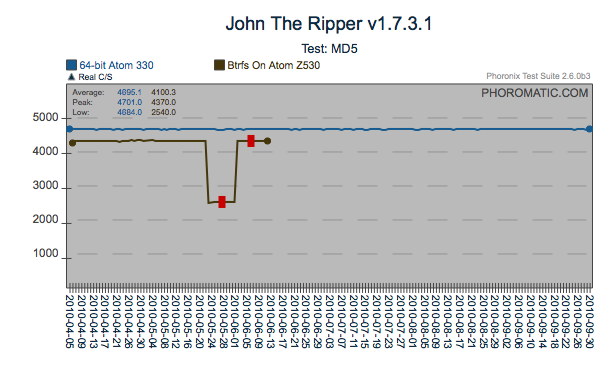
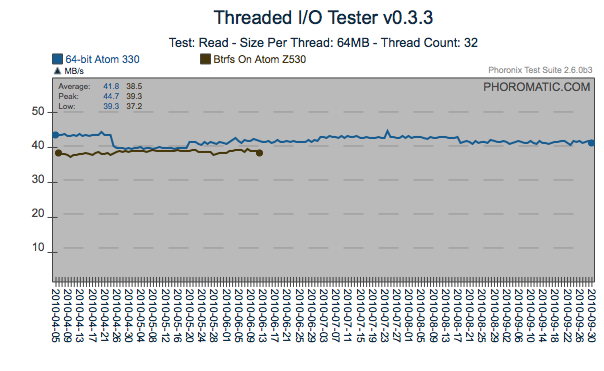
Same Test, Different System Behavior
If multiple differing systems can be made available, hidden behaviors
can be exposed. In this particular case, a regression occurred
only on the 64bit Atom 330 system. With the richness of systems
available globally, having a limited number of test systems can hide
multiple regressions.
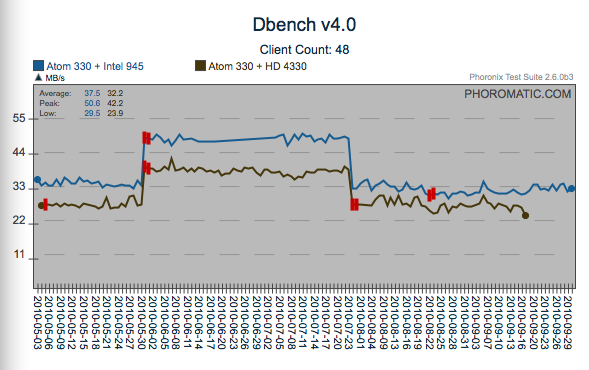
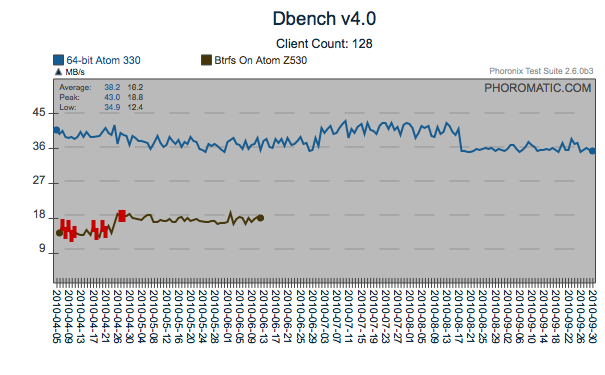
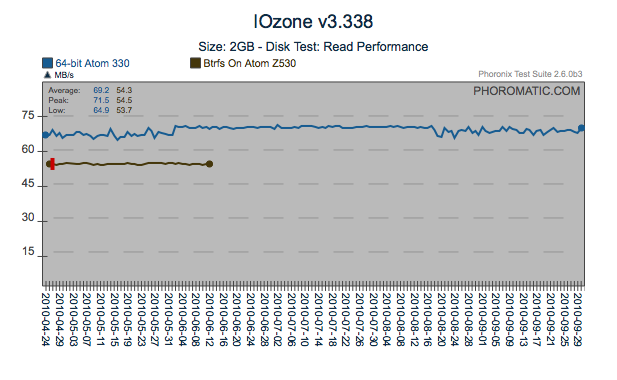
Change in Consistency
This particular test shows a very interesting pattern, the test
exhibited some variability up until the 4th of June, consistent up
until the 12th of August and then variable once more. Although
not a performance regression if you looked at the standard deviation
from test to test, you would see a marked decrease in the system
consistency in the middle with high variability towards the end.
Some Observations and Thoughts
This page is intended to provoke thoughts and analysis only. The
results haven't been verified directly, and as mentioned above there
has been no attempt to isolate the individual cause of the regressions.
Some of the thoughts that came out in the preparation of this
page include.
If you have any particular insight from either the results presented on
this page, please feel free to contact matthew@phoronix.com and
michael@phoronix.com to give us your insight.
Identification of Regressions
Most of the regressions on this page go unfound for a period, and some
have been resolved through serendipity or targeted fixes.
Investing effort up front in systems that allow visualization of
data provide strong insights into changes within a system.
Once a change has been identified, a simple bisection of your ordered
set of changes will usually identify the regressing subsystem.
Unfortunately, most development environments don't invest in the
level of infrastructure needed to make this effective.
Sentinel Tests
A sentinel test that is sensitive to multiple subsystems are extremely
valuable at a system level. The indicate that there is a problem
and that further analysis is needed. An alternate consideration
is that sentinels serve as Canaries in a Coal Mine. They are
variable and sensitive, but a marked change in behavior warrants
immediate investigation.
Variability of Results
A test that provides variable results is generally considered bad.
However even these tests may be multi-modal (potentially a bad
thing), or may have an intrinsic variability that can still be
normalized through successive runs. Control chart theory provides
a good opportunity through Nelson Rules to extract value from these
tests. Even observing the changes in variability from run to run
can provide a high level of value when analysing the system.
Multiplicity of Systems and Tests
As can be seen from the analysis above, just a small number of systems
and a large number of tests can show multiple trends and behaviors that
provide insight into what is happening on a system as the code
changes.
Same Test Different Systems
Extending the observation above, with a larger number of systems you
will find a larger number of regressions. This is particularly
interesting if you consider ways of doing crowd-sourced testing for
distributions or kernels.
Matthew Tippett
matthew@phoronix.com
2010-10-01